Vacuum cleaner usage statistics help explain how people actually clean—when they vacuum, how quickly they do it, and how automation (robot vacuums) is changing routines. Below are the most useful, source-backed vacuum cleaner usage statistics, plus simple charts and a summary table.
Key Vacuum Cleaner Usage Statistics
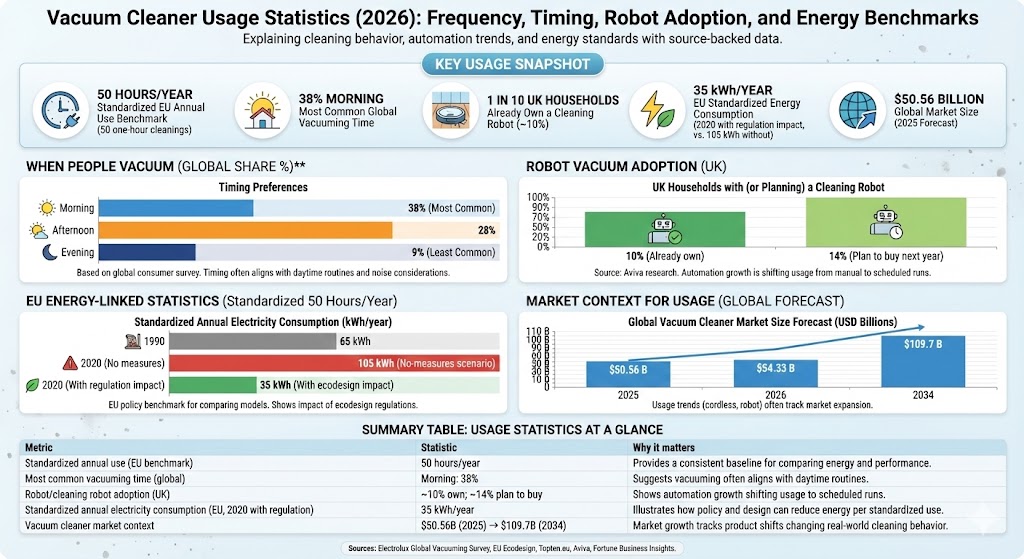
- 50 hours/year is the standardized annual vacuum cleaner “use time” used in EU energy labeling and ecodesign calculations (i.e., a benchmark for comparing models). This is commonly described as 50 one-hour cleanings per year.
- In a global consumer survey, vacuuming in the morning (38%) was most common, followed by afternoon (28%), with evening (9%) least common among the listed time-of-day options.
- In the UK, Aviva research reported 1 in 10 households already own a cleaning robot (commonly interpreted as ~10%), and 1 in 7 plan to buy one in the next year (~14%).
- In the EU, standardized (50 hours/year) electricity consumption for sold regulated vacuum cleaners is described as 65 kWh/year in 1990, a “no-measures” scenario of 105 kWh/year in 2020, and an outcome of 35 kWh/year in 2020 due to ecodesign regulation impacts.
- A major market forecast projects the global vacuum cleaner market at USD 50.56B (2025), USD 54.33B (2026), and USD 109.7B (2034).
Vacuum Cleaner Usage Timing Statistics (Global)
Timing matters for noise, convenience, and household schedules. This chart summarizes reported global preferences for when people vacuum.
Chart: When People Vacuum (Global Share %)
| Time of day | Share | Bar | |
|---|---|---|---|
| Morning | 38% |
| |
| Afternoon | 28% |
| |
| Evening | 9% |
|
Bar fill % (value ÷ max):
Morning 38% → 100.00% fill (max)
Afternoon 28% → 73.68% fill
Evening 9% → 23.68% fill
Robot Vacuum Cleaner Usage Statistics (UK Adoption)
Robot vacuums change “usage” from manual sessions to automated runs. UK survey reporting from Aviva provides a clear adoption snapshot.
Chart: UK Households With (or Planning) a Cleaning Robot
| UK household status | Share | Bar | |
|---|---|---|---|
| Already own a cleaning robot | 10% |
| |
| Plan to buy within the next year | 14% |
|
Bar fill % (value ÷ max):
Already own 10% → 71.43% fill
Plan to buy 14% → 100.00% fill (max)
Vacuum Cleaner Usage Benchmark: Standardized 50 Hours per Year (EU)
When comparing vacuum energy use, EU policy uses a standardized assumption: 50 hours of use per year (often described as 50 one-hour cleanings annually). This is not what every household does, but it is a common benchmark used for consistent comparisons across models.
Energy-Linked Vacuum Cleaner Usage Statistics (EU, Standardized at 50 Hours/Year)
Under the EU’s standardized usage baseline, published summaries describe how vacuum cleaner electricity consumption changed over time and under regulation scenarios.
Chart: EU Standardized Annual Electricity Consumption of Sold Regulated Vacuum Cleaners (kWh/year)
| Scenario / year | kWh/year | Bar | |
|---|---|---|---|
| 1990 (standardized) | 65 |
| |
| 2020 (without measures scenario) | 105 |
| |
| 2020 (with ecodesign regulation impact) | 35 |
|
Bar fill % (value ÷ max):
1990: 65 → 61.90% fill
2020 without measures: 105 → 100.00% fill (max)
2020 with regulation impact: 35 → 33.33% fill
Vacuum Cleaner Market Growth Statistics (Context for Usage)
Usage trends (cordless convenience, robot scheduling, allergy-focused filtration) often track market expansion. The following chart shows a commonly cited vacuum cleaner market forecast trajectory.
Chart: Global Vacuum Cleaner Market Size Forecast (USD Billions)
| Year | USD (B) | Bar | |
|---|---|---|---|
| 2025 | 50.56 |
| |
| 2026 | 54.33 |
| |
| 2034 | 109.70 |
|
Bar fill % (value ÷ max):
2025: 50.56 → 46.09% fill
2026: 54.33 → 49.53% fill
2034: 109.70 → 100.00% fill (max)
Summary Table: Vacuum Cleaner Usage Statistics at a Glance
| Metric | Statistic | Why it matters for vacuum cleaner usage |
|---|---|---|
| Standardized annual use (EU benchmark) | 50 hours/year | Provides a consistent baseline for comparing energy and performance across vacuum models. |
| Most common vacuuming time (global) | Morning: 38% | Suggests vacuuming often aligns with daytime routines (noise and scheduling considerations). |
| Second most common time (global) | Afternoon: 28% | Indicates a sizable share of users clean during mid-day/after-work windows. |
| Evening vacuuming (global) | Evening: 9% | Supports the idea that noise and household downtime can suppress evening vacuum sessions. |
| Robot/cleaning robot adoption (UK) | ~10% own; ~14% plan to buy | Shows automation growth that can shift “usage” from manual sessions to scheduled runs. |
| Standardized annual electricity consumption (EU, 1990) | 65 kWh/year (50 hours/year basis) | Anchors historical consumption under a consistent “usage hours” assumption. |
| Standardized annual electricity consumption (EU, 2020 with regulation impact) | 35 kWh/year (50 hours/year basis) | Illustrates how policy and design improvements can reduce energy per standardized use. |
| Vacuum cleaner market context | USD 50.56B (2025) → USD 109.7B (2034) | Market growth often tracks product shifts that change real-world cleaning behavior (cordless + robot). |
Sources (Exact URLs)
- https://www.electroluxgroup.com/wp-content/uploads/sites/2/2013/10/Electrolux-Global-Vacuuming-Survey-2013-Full-report.pdf
- https://www.electroluxgroup.com/en/wp-content/uploads/sites/2/2013/10/Electrolux-Global-Vacuuming-Survey-2013-Did-you-know.pdf
- https://energy-efficient-products.ec.europa.eu/product-list/vacuum-cleaners_en
- https://eur-lex.europa.eu/LexUriServ/LexUriServ.do?uri=OJ%3AL%3A2013%3A192%3A0024%3A0034%3Aen%3APDF
- https://storage.topten.eu/source/files/PolicyRecommendations_topten_VacuumCleaners_102017.pdf
- https://www.aviva.com/newsroom/news-releases/2025/05/uk-homes-gear-up-for-gadget-boom-from-robot-vacuums-to-smart-devices/
- https://www.fortunebusinessinsights.com/vacuum-cleaner-market-109213