Dyson is one of the most recognized names in cordless vacuums, and its broader company results and product-level performance metrics help explain why. Below are the latest Dyson vacuum statistics and closely related Dyson business stats that shape the vacuum category.
dyson vacuum statistics
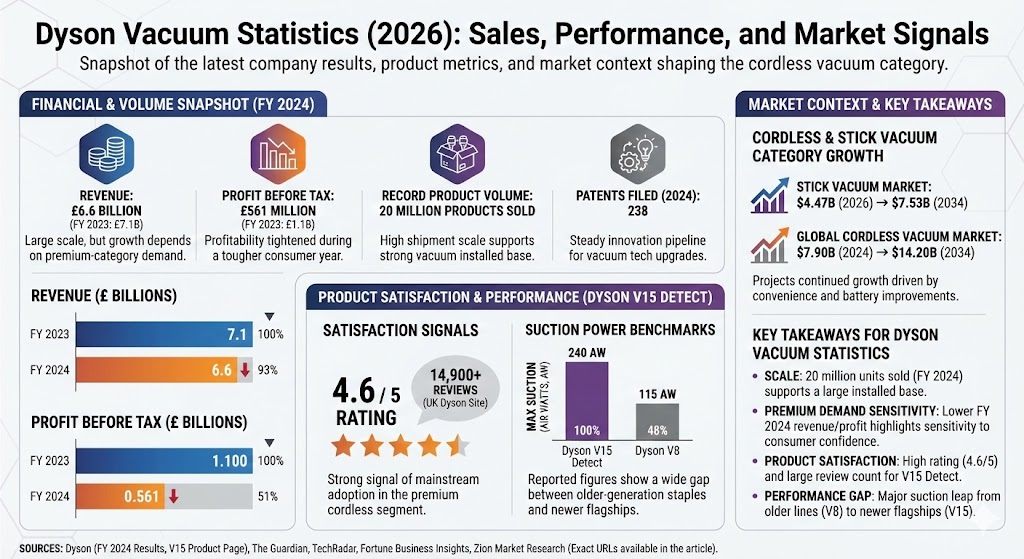
Dyson Vacuum Statistics: Key Numbers Snapshot
Metric
Latest Figure
What It Suggests for Dyson Vacuums
Dyson revenue (FY 2024)
£6.6 billion
Large scale, but growth depends on premium-category demand
Dyson revenue (FY 2023)
£7.1 billion
FY 2024 was lower than FY 2023
Profit before tax (FY 2024)
£561 million
Profitability tightened during a tougher consumer year
Record annual product volume (FY 2024)
20 million products sold
High shipment scale supports strong vacuum installed base
Patents filed in 2024
238
Steady innovation pipeline that can feed vacuum tech upgrades
Dyson V15 Detect rating (UK Dyson site)
4.6 / 5 (14,900+ reviews)
Strong satisfaction signal for a flagship cordless vacuum line
Dyson V15 Detect max suction (media-reported)
Up to 240 air watts
Positions V15 as a high-power cordless stick benchmark
Dyson Financial Statistics That Influence Vacuum Strategy
Even when you’re focused on Dyson vacuum statistics, company-level results matter because they influence R&D spend, product launches, and price positioning. Dyson reported record product volumes in its 2024 results, alongside lower revenue and profit versus 2023.
One of the most useful Dyson vacuum statistics for buyers is verified owner feedback. On Dyson’s UK product listing, the Dyson V15 Detect Absolute is shown with a high overall rating and a very large review count, which is a strong signal of mainstream adoption in the premium cordless segment.
Dyson Vacuum Performance Statistics: Suction Power Benchmarks
When people compare Dyson vacuum models, suction power is one of the most-cited performance statistics. A common way it’s presented in reviews and comparisons is air watts (AW). Reported figures show a wide gap between older-generation staples like the V8 and newer flagships like the V15 Detect.
Dyson Vacuum Statistics Chart: Max Suction (Air Watts, AW)
Model
Max suction (AW)
Bar
Dyson V15 Detect
240
Dyson V8
115
Bar fills: V15 Detect = 100.00%; V8 = 47.92%.
Market Context: Cordless and Stick Vacuum Category Growth
Dyson vacuum statistics are often discussed alongside the broader cordless/stick vacuum expansion, because Dyson’s flagship products compete most directly in these segments. Multiple market trackers project continued growth for cordless and stick vacuums over the next decade, driven by convenience, battery improvements, and multi-surface home cleaning habits.
Stick vacuum cleaner market projection: $4.47B (2026) to $7.53B (2034) in one market outlook.
Global cordless vacuum cleaner market estimate: $7.90B (2024) to $14.20B (2034) in another market outlook.
Takeaways for Dyson Vacuum Statistics
Scale: Dyson reported record product volumes (20 million units sold in FY 2024), supporting a large installed base for vacuums and accessories.
Premium demand sensitivity: FY 2024 revenue and profit were lower than FY 2023, a reminder that premium appliances can be sensitive to consumer confidence.
Product satisfaction: The Dyson V15 Detect shows a high rating (4.6/5) with a very large review count on Dyson’s own listing.
Performance gap by generation: Reported air-watt figures show a major jump from older cordless lines (V8) to newer flagships (V15).