Bissell vacuum statistics highlight a brand that competes strongly on value, pet-focused performance, and wide retail distribution. In the U.S. vacuum category, Bissell is frequently tracked among the leading brands by unit (volume) share, while broader market forecasts suggest sustained growth that can further intensify competition across cordless sticks, uprights, and wet/dry multi-surface cleaners.
bissell vacuum statistics
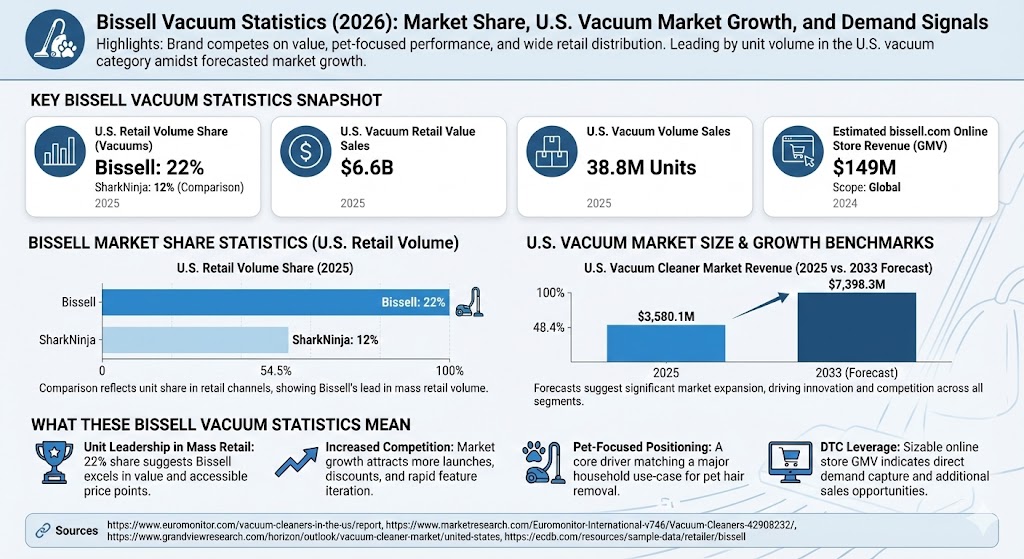
Key Bissell Vacuum Statistics Snapshot
Metric
Stat
Market
Year / Period
Retail volume share (vacuum cleaners)
Bissell: 22%
United States
2025
Retail volume share (comparison)
SharkNinja: 12%
United States
2025
Vacuum retail value sales
$6.6B
United States
2025
Vacuum volume sales
38.8M units
United States
2025
U.S. vacuum market revenue
$3,580.1M
United States
2025
Projected U.S. vacuum market revenue
$7,398.3M
United States
2033 (forecast)
Estimated bissell.com online store revenue (GMV)
$149M
Global (store domain)
2024
Bissell Market Share Statistics
In vacuum brand comparisons, one commonly referenced indicator is retail volume share, which reflects unit share in retail channels. This is especially useful for brands that compete heavily in mass retail with high unit throughput. Based on reported 2025 U.S. category figures, Bissell led by volume share at 22%, with SharkNinja at 12%.
Bissell Vacuum Statistics Chart: U.S. Retail Volume Share (2025)
Brand
Bar
Retail Volume Share
Bissell
22%
SharkNinja
12%
Max = 22%. Widths: Bissell 100.00%, SharkNinja 54.55%.
U.S. Vacuum Market Size and Growth Benchmarks
Looking beyond brand share, broader category benchmarks help explain why the vacuum market remains intensely competitive. A higher-growth outlook typically encourages frequent product refreshes and price competition, especially in segments where shoppers compare features quickly (runtime, suction, filtration, pet hair tools, weight, maneuverability, and wet/dry capabilities).
One U.S. market outlook estimates vacuum market revenue at $3,580.1M in 2025 and projects $7,398.3M by 2033. While forecasts differ by methodology, the core implication is the same: the category is large and expected to remain strategically important—supporting continued innovation and aggressive promotions across brands.
Bissell Vacuum Statistics Chart: U.S. Vacuum Cleaner Market Revenue (2025 vs. 2033 Forecast)
Year
Bar
Revenue (USD Millions)
2025
3,580.1
2033 (forecast)
7,398.3
Max = 7,398.3. Widths: 2025 48.39%, 2033 (forecast) 100.00%.
What These Bissell Vacuum Statistics Mean
Unit leadership matters in mass retail: A 22% retail volume share suggests Bissell performs especially well where shoppers prioritize value and accessible price points.
Growth forecasts can increase competition: A market projected to expand meaningfully tends to attract more launches, deeper discounting, and faster feature iteration.
Pet-focused positioning remains a core driver: In many retail assortments, Bissell’s pet-branded tools and models are designed to match one of the biggest household use-cases (pet hair on carpet and upholstery).
DTC presence adds leverage: A sizable bissell.com GMV estimate indicates the brand also captures demand directly, supporting promotions, bundles, and replacement part/accessory sales outside third-party retailers.