Shark vacuum statistics point to a brand with large-scale sales and consistently competitive third-party test performance. Below are the latest SharkNinja cleaning revenue figures plus independent performance scores and summary benchmarks.
shark vacuum statistics
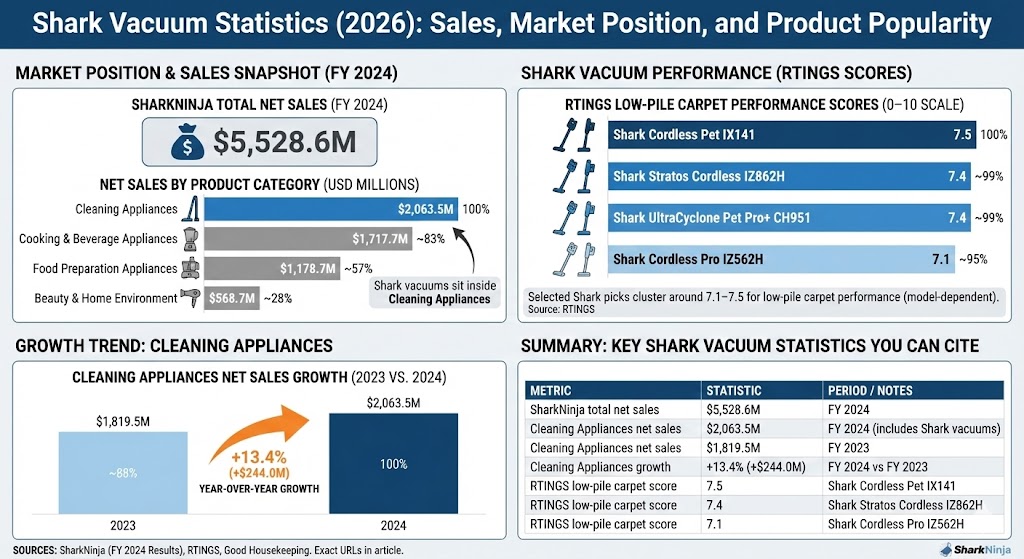
Key Shark vacuum statistics (top takeaways)
$2,063.5M in Cleaning Appliances net sales in 2024 for SharkNinja (the segment that includes Shark vacuums).
+13.4% year-over-year growth in 2024 Cleaning Appliances net sales (vs. 2023).
$5,528.6M total SharkNinja net sales in 2024 across all categories.
Selected RTINGS Shark picks cluster around 7.1–7.5 for low-pile carpet performance (model-dependent).
Shark vacuums sit inside SharkNinja’s Cleaning Appliances category. In 2024, Cleaning Appliances generated $2,063.5M in net sales, up from $1,819.5M in 2023.
SharkNinja 2024 net sales by product category (USD millions)
Cleaning Appliances net sales growth (2023 vs. 2024)
Label
Bar
Value
2023
1,819.5
2024
2,063.5
Max = 2,063.5. Widths: 2023 88.17%, 2024 100.00%.
That change equals an increase of $244.0M in Cleaning Appliances net sales, or +13.4% year over year.
Shark vacuum performance statistics (independent test scores)
Third-party lab testing is a fast way to compare real-world pickup performance. The examples below use a consistent category score (low-pile carpet) for selected Shark recommendations.
Max = 7.5. Widths: Shark Cordless Pet IX141 100.00%, Shark Stratos Cordless IZ862H 98.67%, Shark UltraCyclone Pet Pro+ CH951 98.67%, Shark Cordless Pro IZ562H 94.67%.
Shark vacuum reliability and owner satisfaction signals
Reliability varies by model and usage intensity, so it’s best read as a pattern across sources rather than a single “one number” claim. Survey-driven consumer coverage and long-running test outlets frequently list Shark models as strong value options, especially for upright and cordless categories.
Summary table: Shark vacuum statistics you can cite